Fintech on File #1 | PayPay IPO, ICE invests in OKX, Stripe vs. Adyen
March 11, 2026

Welcome to Fintech on File. With no shortage of news these days, the objective of this newsletter is to collect, synthesize, and explain from my perspective what is happening in fintech. This will cover company and sector news, company earnings, IPOs and mergers, and more. Whether you’re an investor, operator, or simply someone trying to develop a better signal on the sector, I hope this becomes a trusted part of your process. Going forward, this will be a weekly publication — though this inaugural edition covers the past month of research.
The Deal Room
PayPay IPO
Japanese payments company PayPay is expected to IPO today, with Reuters reporting the IPO is expected to price below at $16 per share, below the low-end of the $17-20 per share target range — or a ~$10.7B market capitalization. The SoftBank-backed company was aiming to raise $1.1B in the IPO at the high-end of the valuation, which implied a $13.4B market capitalization.
PayPay will test the waters when most payments companies have had a rough go of it as of late with the Global X Fintech ETF FINX down ~15% year-to-date. PayPay has a unique combination of growth and profitability. In the quarter ending December 2025, PayPay grew gross merchandise volume 22% year-over-year, with revenue growing 24% and adjusted EBITDA growing 63% year-over-year. PayPay has generated material operating leverage over the past several quarters with adjusted EBITDA margins increasing from 7.2% in CY Q4 2023 to 24.3% in the same quarter in 2024 and 31.9% in 2025. Japan’s payment market is largely cash-based, unlike other developed economies, with ~48% of the market still paid for in cash.[1] PayPay has a dominant position with monthly transacting users accounting for 42% of Japan’s smartphone population and its code-based payment share at 64% in 2024.[2]
Using rough estimates that assume the current revenue trajectory holds with flat-to-up margins, if PayPay prices at $17 and can grow EBITDA 20–30% in 2026, the stock trades at 14.2–15.4x forward EBITDA. This compares to ~11x 2026 EV/EBITDA for the ~13 fintech companies I follow with expected revenue growth of 20-30% in 2026.
Fintech In The News
ICE Invests in OKX at $25B Valuation | CoinDesk
ICE is making a strategic investment in OKX at a $25B valuation. As part of the investment, ICE will license OKX’s spot crypto prices to launch crypto futures products, while OKX will offer ICE futures and tokenized equities to its customers in the U.S. This is ICE’s second major crypto investment following its $2B investment in Polymarket this past October that valued the blockchain-based prediction market company at a $8B pre-money valuation.
Nasdaq Partners With Kraken in Plan for 24/7 Tokenized Stock Trading | WSJ
Just a few days after the ICE/OKX announcement, Nasdaq announced a partnership with Kraken to power 24/7 tokenized stock trading. As tokenization goes mainstream, legacy financial institutions, including exchanges, are opting to partner rather than build in order to prioritize speed to market. These are starting as minority investments and partnerships, but it seems like the natural end state will be a wave of consolidation as legacy providers try to cement their existing position in the market.
OpenAI Scales Back Shopping Plans for ChatGPT | The Information
OpenAI is positioning itself more as a lead generation, marketplace model than a merchant of record. The early phases of “agentic” commerce looks a lot like the ecommerce consumers are used to with a different demand aggregator at the top of the funnel. As we saw from Google in the past decade, it continued to make a push deeper into the commerce funnel, especially in sectors like travel. Settling as a tax on demand wasn’t for a lack of trying to move into transactional commerce. My guess is this will be similar for agentic commerce: where the respective models start today is unlikely to be where they end up over time (or at least, it won’t be for a lack of trying). I discussed more thoughts on agentic commerce and how it could develop here: The (Ecommerce) Agents Are Coming
Robinhood Ventures Fund I (RVI) Declines 11% in its Trading Debut | CNBC
Robinhood’s Venture Fund I (RVI) declined 11% in its public market debut at the New York Stock Exchange and has traded at these levels since the public listing last Friday. The fund offers exposure to notable private companies such as Revolut and Databricks, but is missing some of the largest private companies, including SpaceX or Stripe (the latter which Robinhood said “is coming soon”). Robinhood’s CEO Vlad Tenev is publicly focused on increasing retail investors’ access to the private markets. I have several questions about this structure, which I outlined in a recent note.
Revolut OCC Bank Charter Filing | PYMNTS
Revolut filed for a national bank charter with the OCC and for deposit insurance with the FDIC, signaling it is no longer content to operate in America through partner arrangements. A successful application would give Revolut direct connections to Fedwire and ACH, and the ability to offer personal loans and credit cards.
What I Wrote This Week Month
This section will typically cover the prior week. For this inaugural edition, I’ve included the past several weeks, which omits articles mentioned above.
Stripe vs. Adyen Comparison (2025) | February 24, 2026
As a public company, Adyen faces the scrutiny of the public markets (including my post-earnings writeup). Stripe has largely avoided this by staying private and offering employees and investors liquidity through annual tender offers. In the past few years, Stripe has avoided the distractions that come with being publicly traded – and has the benefit of seeing its valuation appreciate materially, while other fintech peers see their stocks under pressure.
Adyen and Stripe are a duopoly in cloud-native ecommerce merchant acquiring, with Braintree and Checkout.com distant 3rd and 4th players. Unfortunately, for public markets investors, we only get to compare the financial performance of Adyen and Stripe once a year when Stripe releases its annual letter. And even more unfortunate, is that Stripe only releases a handful of data points like total processing volume and some related revenue or growth metrics. However, this is the closest look we get at comparing the past year’s performance of these payment giants. Here is my take on the results.
Payments: Assessing the AI, Agentic, and Stablecoin Risks for Merchant Acquirers | February 5, 2026
Narratives surrounding AI, agentic commerce, and stablecoins are becoming more prevalent in fintech and payments specifically. The regulatory and compliance aspects of payments makes it more likely that AI is an accretive innovation to existing incumbents versus disruptive and the existing payment four-party model is well-positioned to capture the growth in agentic commerce.
Figure (FIGR), Part 1: Building the Fannie Mae & Freddie Mac of Non-Qualified Lending February 4, 2026
Figure is one of the most fascinating publicly traded fintechs currently. The company has audacious goals to recreate much of how the capital markets works on the blockchain. Figure started with HELOCs but is quickly expanding into other asset classes, including auto loans. It’s not just the promise of big dreams - Figure is executing against this, which shows up in the numbers. In Q4, Figure grew transaction volume 131% year-over-year. The company recently released its February monthly metrics, showing volume grew 127% year-over-year.
My “Part 2” on Figure is long overdue.
Data That Matters
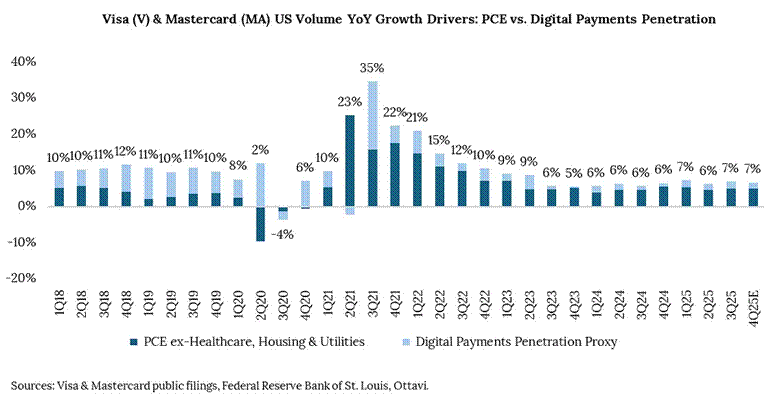
Visa & Mastercard’s US Payment Volume Growth Decomposed: PCE Growth vs. Digital Payments Penetration Gains
The graph below decomposes the total payment volume growth of Visa (V) and Mastercard (MA) into adjusted personal consumption expenditures (PCE) growth and digital payments penetration gains. I adjusted PCE to exclude healthcare, housing & utilities since these are mostly non-addressable for typical consumer card payments. The proxy for digital payments penetration is calculated by subtracting adjusted PCE growth from V and MA total volume growth. Since the two operate a duopoly, end-market growth is adequately captured through adjusted PCE growth.
Notably, in the three years preceding the pandemic (2017-2019), digital payments penetration accounted for 60%+ of V & MA’s US growth. Since 2022, it’s ~20%. At V’s February 2025 investor day, it stated US digital payments penetration was 60%+ — my rough math puts it over 70%. With ~80% of volume growth driven by end-market growth, this increases the inherent cyclicality in their US businesses. I explained this in more detail in a follow-up X post:
If you think about $V and $MA long-term volume growth drivers, it’s been a combination of personal consumption expenditures (PCE) — or the amount consumers are spending on goods and services regardless of what payment instrument they’re using — and digital payments penetration increasing — or the increasing number of consumers using digital/card payments versus cash or check (or a cardholder who already has a card using it for a higher percentage of their purchases over time).
For a long time, $V / $MA volume growth was more evenly split between end market / PCE growth and increasing digital penetration. This allowed them to sustain higher than industry growth (ie PCE) — typically ~2x that rate — and allowed both to maintain a certain level of growth in cyclical downturns (PCE falls but digital penetration gains carry more weight so they still grow) but given growth has converged more to PCE growth and digital penetration is going to be less of a driver moving forward, $V / $MA volume growth will more closely reflect PCE, which means it’ll be more heavily tied to macro economic up/down cycles — and generally, will grow slower going forward assuming PCE remains ~stable.
Notably, this says nothing about the investing merits of V and MA. Both have meaningful international exposure that grows faster than the domestic business – and revenue from value-added services (VAS) is an increasingly important driver of revenue growth (both have done a good job here), but understanding the building blocks of their US growth is an important aspect of thesis.
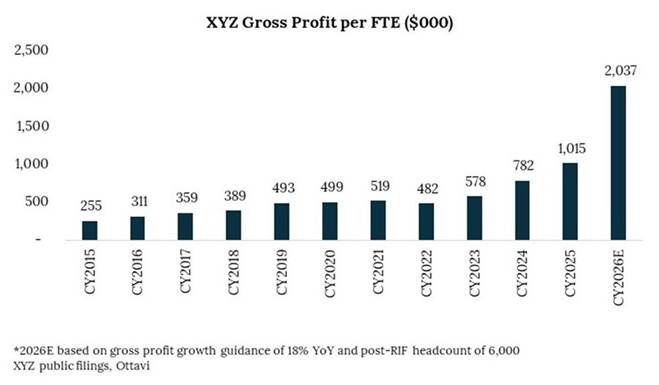
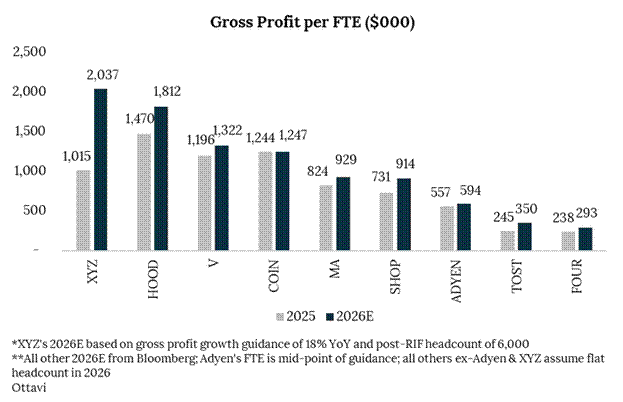
Block (XYZ) Operating Efficiency
Alongside Q4 earnings, Block announced a layoff affecting 40% of its workforce, with CEO Jack Dorsey citing advancements for the company in leveraging AI internally as a key consideration. Among investors, this sparked a debate about whether AI was the reason or XYZ was an overbloated organization and “AI” was a convenient excuse to reduce its workforce. Dorsey responded to an X post claiming “managerial incompetence” from overhiring during Covid by saying:
yes we over-hired during covid because i incorrectly built 2 separate company structures (square & cash app) rather than 1, which we corrected mid 2024. but this misses all the complexity we took on through lending, banking, and BNPL. and that we’re now targeting $2M+ gross profit per person, 4x our pre-covid efficiency, which stayed flat at ~$500k from 2019 until 2024. we have and do run an efficient company... better than most.
Below is the operating efficiency Dorsey cited by year. Operating efficiency was range-bound from 2019-2022 but is on pace to increase 4.2x since then based on 2026 guidance and double year-over-year. Furthermore, XYZ screens as the most “efficient” fintech in its peer set. I put efficient in quotes, because gross profit per full-time employee is a blunt instrument to gauge operating efficiency. Ultimately, I think XYZ was too bloated and its operating efficiency was insufficient for a business generating over $10 billion in gross profit. It’s also likely seeing some early proof points of efficiency from AI. Lastly, other fintechs are even more bloated, which is likely foreshadowing a focal point for the sector as we move through 2026.
**Caveats are I used $XYZ’s post-RIF headcount; Adyen’s mid-point of their FY guide while the rest I assumed flat headcount. This penalizes Adyen while benefitting XYZ, but the chart is meant to be directionally illustrative, not a precise ranking.
.
[1] PayPay’s F-1 IPO prospectus.
[2] PayPay’s F-1 IPO prospectus.