US Hotel Franchisors in 2025: Luxury Thrives, Economy Struggles – Does Outlook for 2026 Rebound Mean Long Wyndham (WH)?

Recap: The six major U.S. hotel franchisors—Marriott, Hilton, Choice, Wyndham, InterContinental, and Hyatt—control about 58% of the market through multi-brand portfolios that span luxury to economy segments, operating an asset-light model where they license brands and systems to franchisees in exchange for royalty and other fees totaling 8-10%+ of revenue. This structure delivers high recurring revenues, low capital intensity, EBITDA margins often exceeding 50%, and strong free cash flow conversion, enabling substantial shareholder returns via buybacks and dividends. In 2025, the industry experienced sharp bifurcation, with luxury segments achieving ~5% RevPAR growth while the economy segment suffered prolonged declines of ~3%, severely impacting lower-end-exposed companies like Wyndham and Choice. Looking to 2026, easier comparisons, potential economic tailwinds (e.g., higher tax refunds, real income growth), and events like the World Cup position the lower-end segment for a cyclical rebound, potentially driving accelerated EPS growth and attractive returns for discounted stocks like Wyndham.
A Quick Primer on Hotel Franchisors
In the US, Marriott (MAR), Hilton (HLT), Choice (CHH), Wyndham (WH), InterContinental (IHG), and Hyatt (H) collectively account for ~58% of the hotel market, measured by total rooms. Over time, the “large 6” have consolidated large brand portfolios through acquisitions and organically creating new concepts. When you stay at a hotel in the US, there’s a greater than 50/50 chance it’s one of the brands owned by these large brands.

Source: STR; as of November 2025
CoStar’s STR, considered the definitive data source for tracking US hotel trends, classifies hotels into six primary chain scale segments for branded properties: Luxury, Upper Upscale, Upscale, Upper Midscale, Midscale, and Economy (with Independents as a separate category). These segments are grouped primarily by the chain’s actual global system-wide average daily rate (ADR) from the previous year, ranking from highest (Luxury) to lowest (Economy). STR updates assignments annually based on ADR performance and other factors. Average ADR for Economy year-to-date through November 29 is $71 versus $160 for the total US and $442 for Luxury.
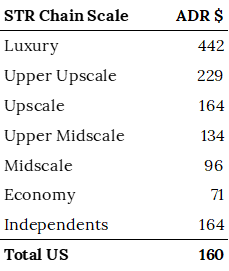
Source: STR; year-to-date weekly average through November 29, 2025.
Strategically, major players use a multi-brand portfolio approach to maximize their market penetration. Companies like Marriott and IHG cultivate a diverse collection of brands to serve different price points and travel preferences. This allows them to deepen their relationship with geographically focused franchisees, who can develop multiple non-competing properties in the same market (e.g., a Hilton franchisee with a Hampton Inn and a Home2 Suites). Furthermore, this breadth is critical for driving engagement in their massive loyalty programs, ensuring they can capture a traveler’s business regardless of destination or budget.
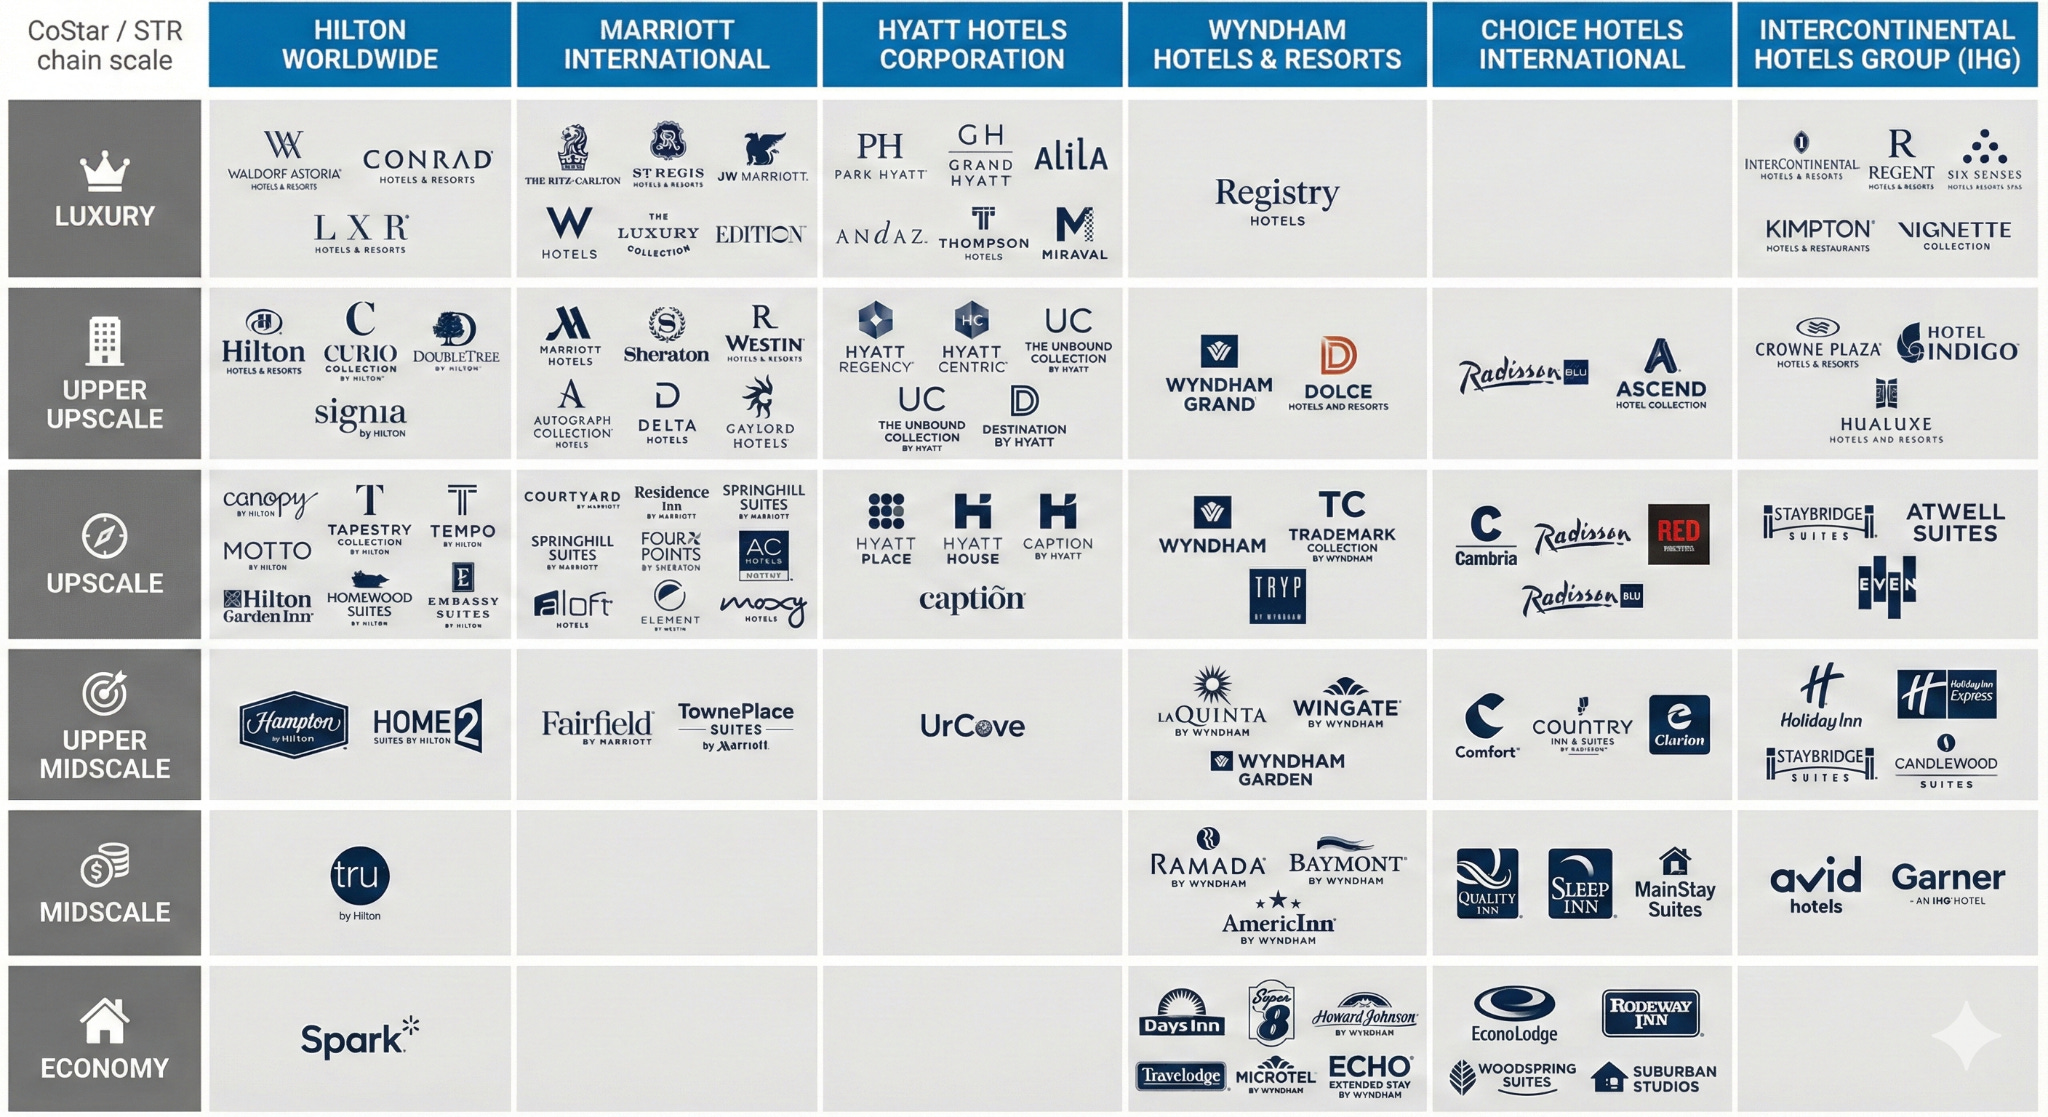
*above brand segmentation may not be 100% accurate.
Hotel franchisors, such as MAR, HLT, and WH, primarily operate an asset-light business model by licensing their established brand names, trademarks, operating systems, and technology platforms—including central reservation systems, revenue management tools, loyalty programs, and distribution channels—to independent hotel owners (franchisees). In exchange, franchisees pay a relatively small initial franchise fee upon signing the agreement to cover application, inspection, and setup costs, followed by ongoing fees that typically total 8–10%+ of the hotel’s revenue.
The core recurring revenue for franchisors comes from royalty fees, usually 4–6% (or up to 10% for premium brands) of gross rooms revenue, sometimes extended to food and beverage or other sources; additional contributions include marketing/advertising fees (2–4%), reservation system fees, and loyalty program assessments. This structure aligns incentives: franchisors earn more when franchisees achieve higher occupancy and rates across the brand’s ecosystem, while enabling rapid global expansion without capital-intensive property ownership or operational risk.
Franchisees typically sign long-term agreements—often 15-20 years, resulting in a highly retentive customer base. MAR and HLT are best-in-class, with annual room churn is ~1%, while WH’s lower-end segment mix results in a higher, albeit still low, annual churn rate of ~4%. This, plus franchisors’ mostly take rate model, means large brands enjoy a highly recurring revenues base that is indexed to growth in the travel market—a sector that has structurally grown at or above nominal personal consumption expenditures (PCE) over the last 10-20 years. Although franchisors’ revenue from franchisees is contractual, the franchisor’s room revenue tends to be cyclical, driven by macroeconomic factors.
Since franchisees are responsible for the capital outlay and operating the hotel, the franchisor needs to expend little incremental capital to grow revenue and profit, resulting in high EBITDA margins and free unlevered free cash flow conversion. EBITDA margins typically exceed 50%, with larger-scale players—MAR and HLT—generating fee-based EBITDA margins significantly above this. Required capital expenditures consist of software costs (typically in the low- to mid-single digits) and “key money.” Key money is an upfront financial contribution by the franchisor to the owner as an incentive to secure a long-term franchise agreement. This payment, often used in competitive markets to gain brand presence in strategic locations, helps fund renovations, development costs, or the owner’s capital stack, and is typically amortized over the agreement term or requires partial repayment upon early termination. Key money varies more by franchisor. HLT is at the low end, with total key money likely to be at ~3% of fee-based revenue in 2025, while MAR and WH are trending toward 7-8% of fee-based revenue. Even after accounting for these capital outlays, unlevered free cash flow conversion can exceed 80%. Altogether, franchisors’ highly cash generative business models results in returning nearly all—or more than all—of their free cash flow to shareholders through buybacks and dividends.
The large 6 franchisors weren’t always asset-light. In fact, while most generate most of their EBITDA from franchise fees today, this was not the case a decade ago. Each has spun off business units (timeshare, REITs) or sold owned assets to simplify the story and create a more predictable EPS/free cash flow per share story.
The combination of growing units, indexed to travel, high free cash flow conversion, and capital returns yields a free cash flow per share algorithm that’s attractive and has historically generated compelling shareholder returns. Over the past five years, only WH and CHH trail the S&P 500.
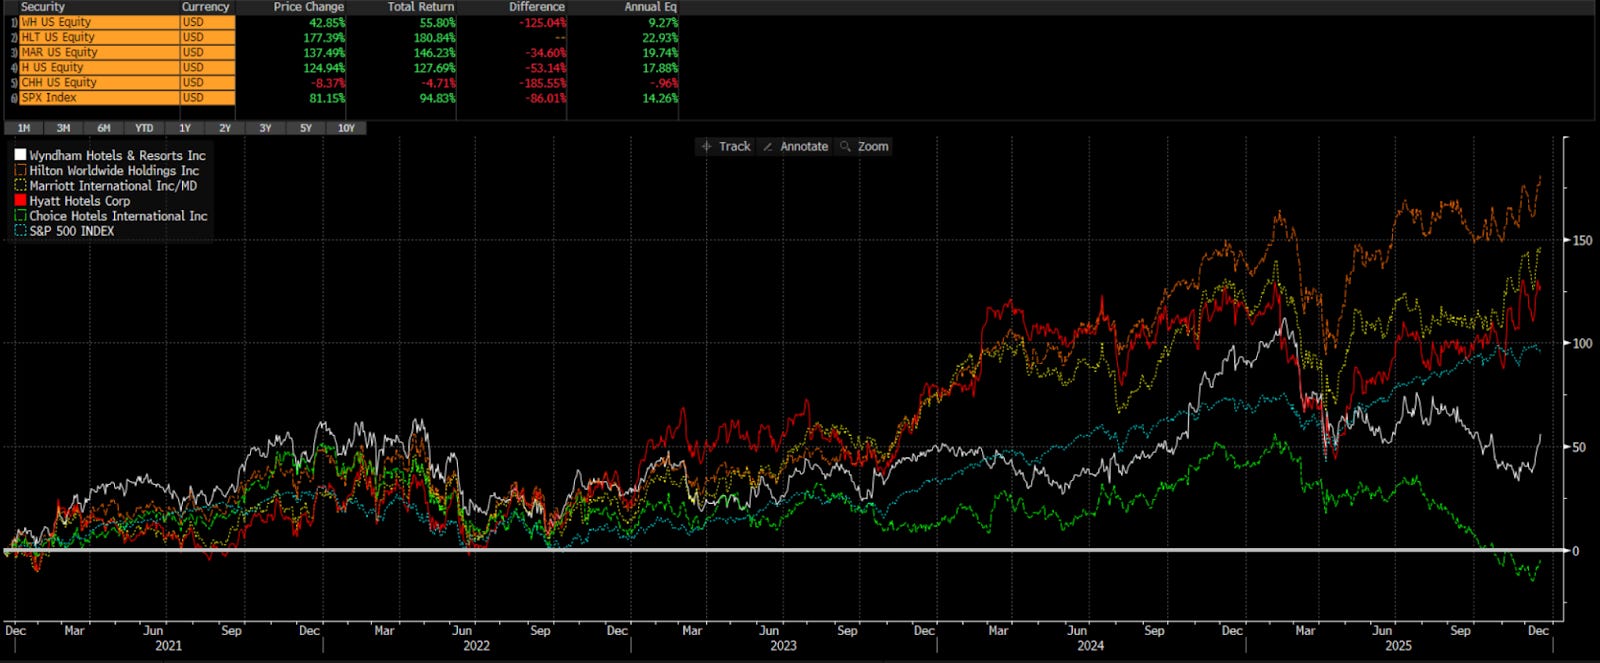
Source: Bloomberg
At the core is a 6-9% increase in room-based fees from 4-6% net unit growth and 2-3% revenue per available room night growth (essentially, end-market growth). Mix-shift to franchisees with higher royalty rates and ancillary fees (think, co-brand credit card fees), can push total fee-based revenue growth to 8-11%. With slight operating leverage and ~100% of free cash flow returned via buybacks and dividends, publicly traded franchisors typically reduce shares outstanding by 3-5% per year, depending on valuation and the free cash flow return ratio; the remainder is returned via dividends. This delivers 12-15% sustainable EPS / free cash flow per share growth, with minimal disruption risk and a slightly higher total shareholder return when dividends are included.
2025: The Year of Bifurcation
The U.S. travel market in 2025 was characterized by volatility and a stark divergence in performance (as highlighted in June and November). A clear divide emerged between the high-end luxury segment, which continued to thrive, and the lower-end economy segment, which faced significant and persistent headwinds. This created a challenging landscape for hotel companies with more exposure to the lower end, like WH and CHH.
The lower-end of the market has been contracting for most of the period since 2023. The initial weakness stemmed from lapping the exceptionally strong “revenge travel” period that followed the pandemic, compounded by the expiration of COVID-related government stimulus which disproportionately supported lower-income consumers. This environment was briefly interrupted in late 2024 and early 2025, when displacement from hurricanes Helene and Milton created a temporary surge in demand for economy and midscale lodging in the Southeast. However, once this tailwind faded, the underlying softness returned.
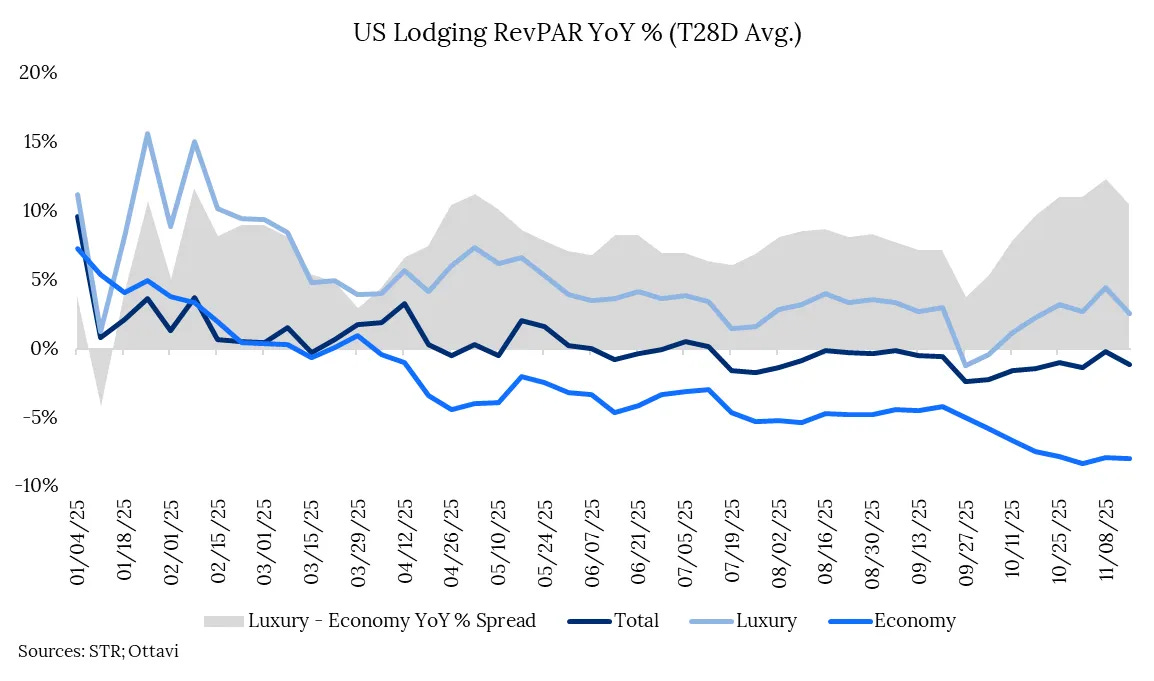
In 2025, this divergence became extreme. Luxury hotels posted approximately 5% growth in Revenue Per Available Room (RevPAR), a key industry metric calculated by multiplying a hotel’s average daily rate (ADR) by its occupancy rate. In stark contrast, Economy properties saw RevPAR decline by about 3%, creating an 8-percentage-point performance gap. This spread has recently widened to a staggering 11 points. Underscoring the severity of this downturn, the Economy segment has now endured 35 consecutive weeks of year-over-year RevPAR decline since March 2025.
The bifurcation between higher-end and lower-end consumer has been seen elsewhere in the economy, driven by increasing wealth effect on the high-end and low relative real income growth on the lower-end. This bifurcation has also been reflected in consumer sentiment surveys.
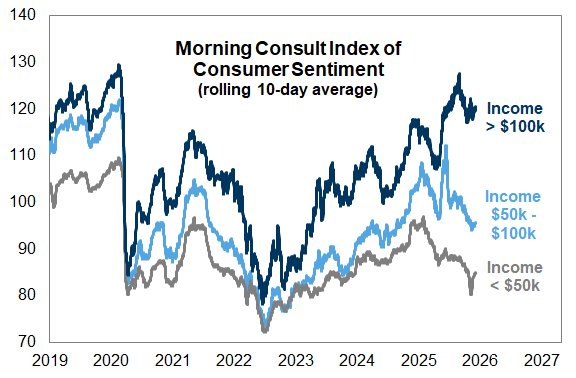
Sources: Morning Consult, Goldman Sachs Global Investment Research
To put a finer point on the duration of the lower-end weakness, the graph below compares year-over-year RevPAR growth from the first negative week during the Great Financial Crisis and from the recent period starting Mar 2023. The GFC was a more severe contraction but the duration now well surpasses even the GFC. The graph shows weekly growth returns in Q4 2024, but as pointed to above, this was mostly due to displacement from hurricanes. Looking at it on a 2-year basis since Sept, 10/11 weeks have been negative—indicating that, excluding the hurricane bump, trends would’ve remained weak last year. This was further impacted by the government shutdown, which is still being felt a month after it concluded.
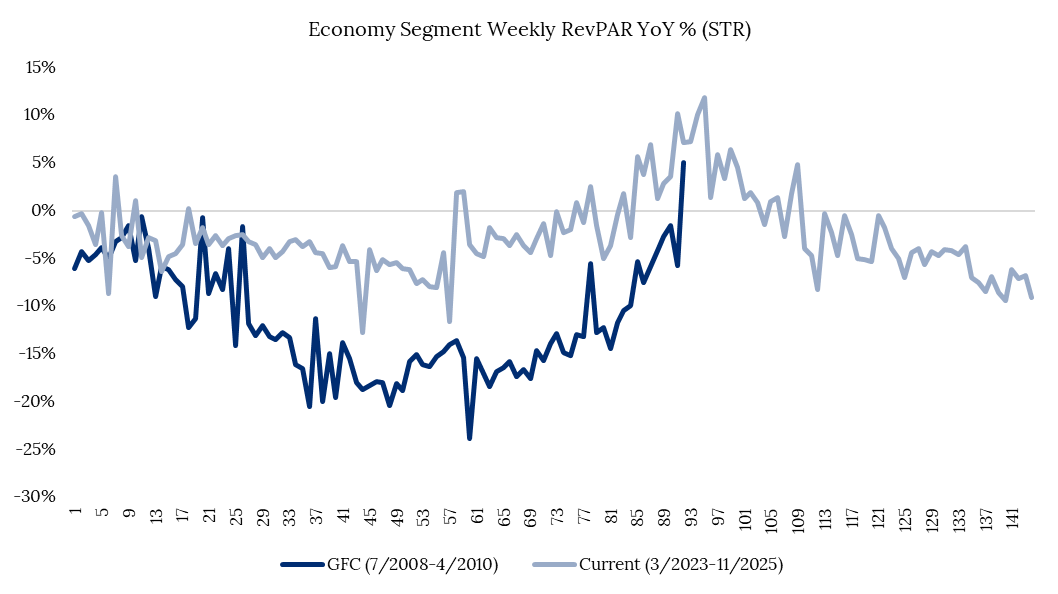
Sources: STR, Ottavi
The Case for a 2026 Rebound
The investment case for the broader lower-end lodging segment in 2026 is centered on a potential cyclical recovery. The thesis is built on the idea that 2025’s persistent headwinds will become easier comparisons to lap, while emerging economic tailwinds could provide a much-needed boost to the core economy-segment consumer.
Several potential catalysts could drive improved performance in 2026. The year will benefit from lapping the “death by a thousand cuts” environment of 2025, which saw numerous small but cumulative negative impacts (Doge, tariffs, government shutdown, etc.). More concretely, consumers are expected to receive higher tax refunds in the first half of 2026, which could directly stimulate travel demand among lower- and middle-income households. Forecasts from Goldman Sachs suggest a stabilization or improvement in real income growth for the cohorts most critical to Wyndham’s customer base. While the lowest income cohort’s growth is expected to slow, all other cohorts are projected to see stable to accelerating real income growth.
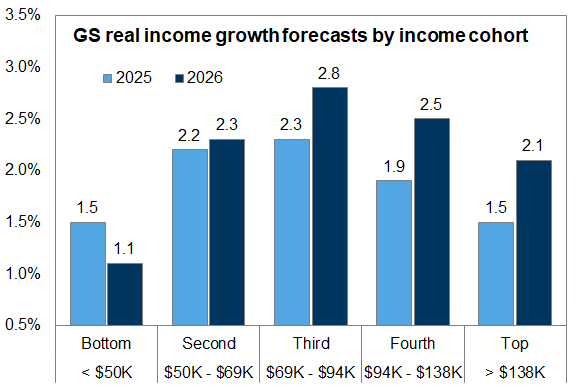
Income ranges estimated based on 2022 BEA data in current dollars.
Sources: US Bureau of Economic Analysis (BEA), Goldman Sachs Global Investment Research
Additionally, 2026 will benefit from several favorable calendar shifts, America’s 250th birthday celebration and the World Cup in June and July. Marriott estimates that the World Cup could increase its global RevPAR by 30-35bps, which could imply a ~40bps growth tailwind in the US.
Most consensus estimates have the overall US lodging market growing ~1% in 2026 with Luxury outperforming while Economy lags the overall industry. While plausible for the market overall (I think the likely outcome is higher), the Economy segment could outperform materially if stimulus drives demand growth. From the beginning of Q2 through November, Economy RevPAR is down an average of ~5% year-over-year. Typically when lodging segments come out of this type of contraction, they don’t just grow 1%, they overshoot to the upside. In the 52 weeks following the last negative weekly print after the GFC, the overall market and Economy segment grew 7% and 8%, respectively, after declining 13% in the prior 52-week stretch. By no means is this meant to compare the current period to the GFC, but to show a -5% for three-fourths of 2025 is unlikely to produce 1% growth in the following year.
Ultimately, there will be surprises—positive and negative—as there tends to be in any given year, but 2026 is setting up to be a recovery year after 2025’s weakness. This should benefit all lodging chain scales, with total RevPAR likely to return to low-single-digit growth. Forward-looking data remains weak until mid-February when the hurricane comps are lapped and easier comps from Doge and Liberation Day begin. Hotel booking windows tend to be relatively short (~30-45 days) but the data is constructive to a better H1. There’s consensus that Luxury’s strength will continue as long as wealth effects persist from a strong stock market, but is this the year that…Economy outperforms? It seems plausible. If so, it begs the question how this could translate into stock performance for WH and CHH who are more exposed to the low-end of the market.
Implications for Lodging Stocks
Hilton (HLT), Marriott (MAR), Intercontinental (IHG), and Hyatt (H) are all positive on the year—with only HLT beating the market ever so slightly (15.8% vs. S&P 500 at 15.6%). WH and CHH are down 22% and 35%, respectively, trailing HLT and the market by ~36% and ~50%, respectively. The entire group has rallied in the past ~week.
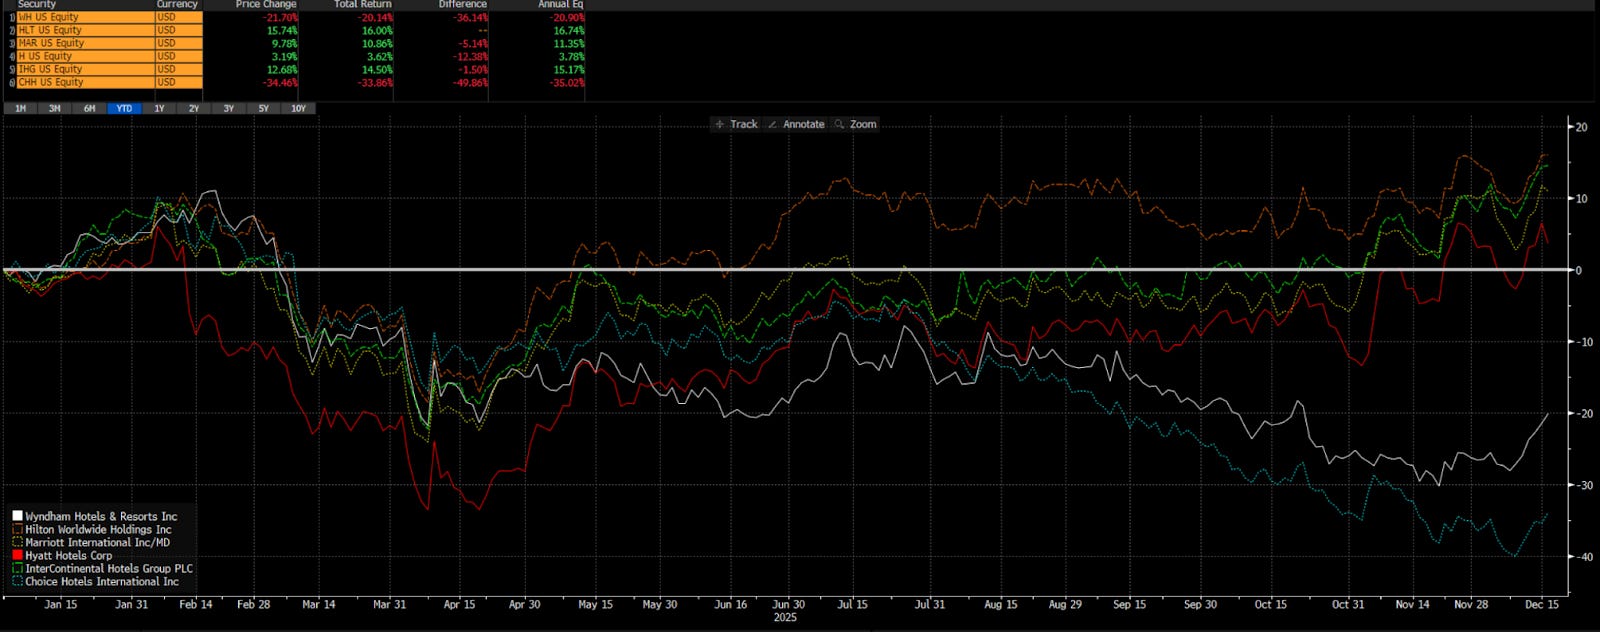
Source: Bloomberg
HLT trades at a premium to the peer set due to its best-in-class net unit growth with guidance at 6-7% for 2025 and for the foreseeable future and higher free cash flow conversion from lower key money relative to peers. While HLT trades at a premium, MAR/H/IHG trade more tightly, while WH and CHH more decoupled from the pack in 2025.
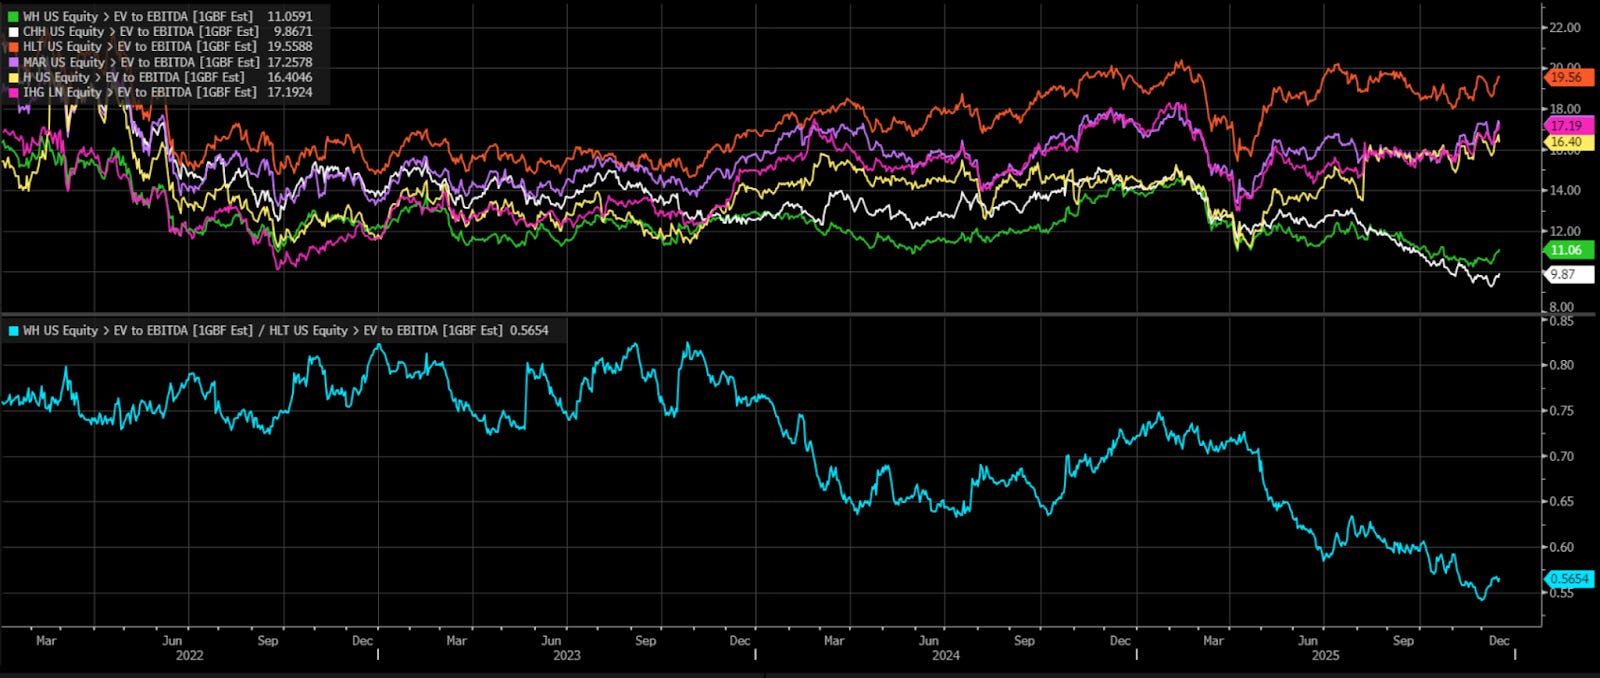
Source: Bloomberg
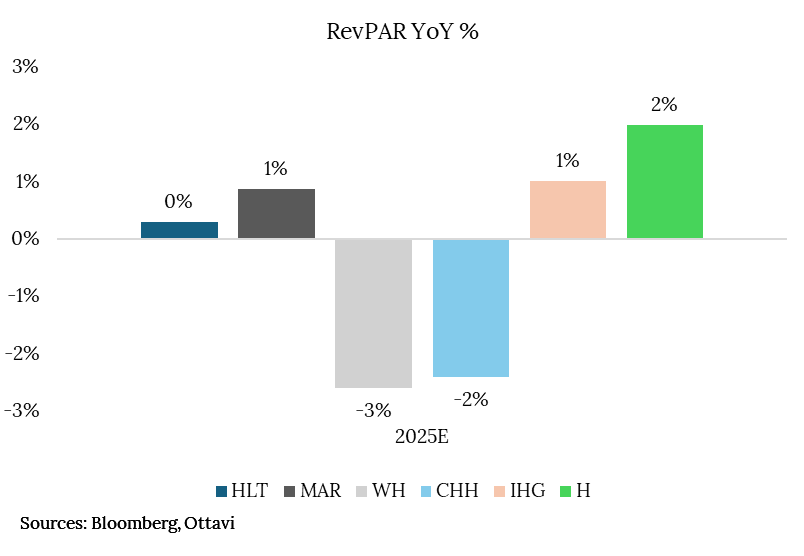
The further decoupling of WH and CHH in 2025 was due in part to a bifurcation in RevPAR growth, which widened adjusted EPS growth dispersion relative to typical levels (in addition to long-term concerns about HLT and MAR moving more into their core segments). ~50%+ of WH and CHH’s total rooms are from the US lower-end segment (Economy and Upscale). Compared with HLT, MAR, and H, the Economy segment has very little exposure, even if both are expanding more into WH and CHH’s segments. Furthermore, both benefited more significantly from stronger international RevPAR trends. This meant that even in a relatively choppy lodging market, RevPAR for those not named WH or CHH is expected to finish 2025 flat to up ~2%, while WH and CHH declined by 3% and 2%, respectively.
This resulted in WH and CHH revenue lagging peers, likely only finishing up 0-2% with EPS similarly trailing.
*Hyatt is omitted given sales from assets materially impacted adj. EPS.
Making the Case for Wyndham
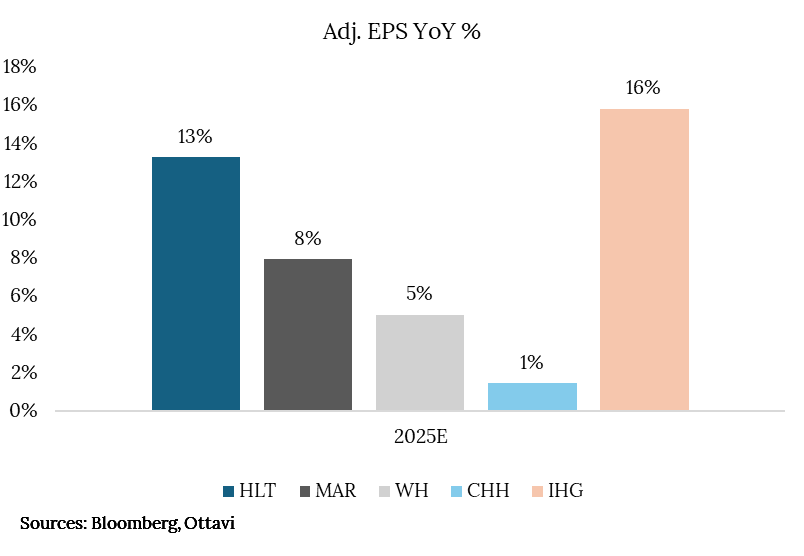
Going into 2026, much of the peer set is positioned to grow EPS in the double-digits, except for CHH which has the headwind for much more lackluster net unit growth holding it back. If HLT/MAR/H/IHG hold their current multiples, these could produce low-to-mid-teens returns in 2026. Alternatively, one could paint a picture of accelerating growth for WH/CHH, which both trade at a discount to their historical multiples and relative to peers.
However, due to a better outlook for net unit growth (~4%), WH has a much more straightforward case to accelerating adjusted EPS to at least the low-teens, which would be 5-8 percentage points higher than 2025 and more in line with peers, including HLT.
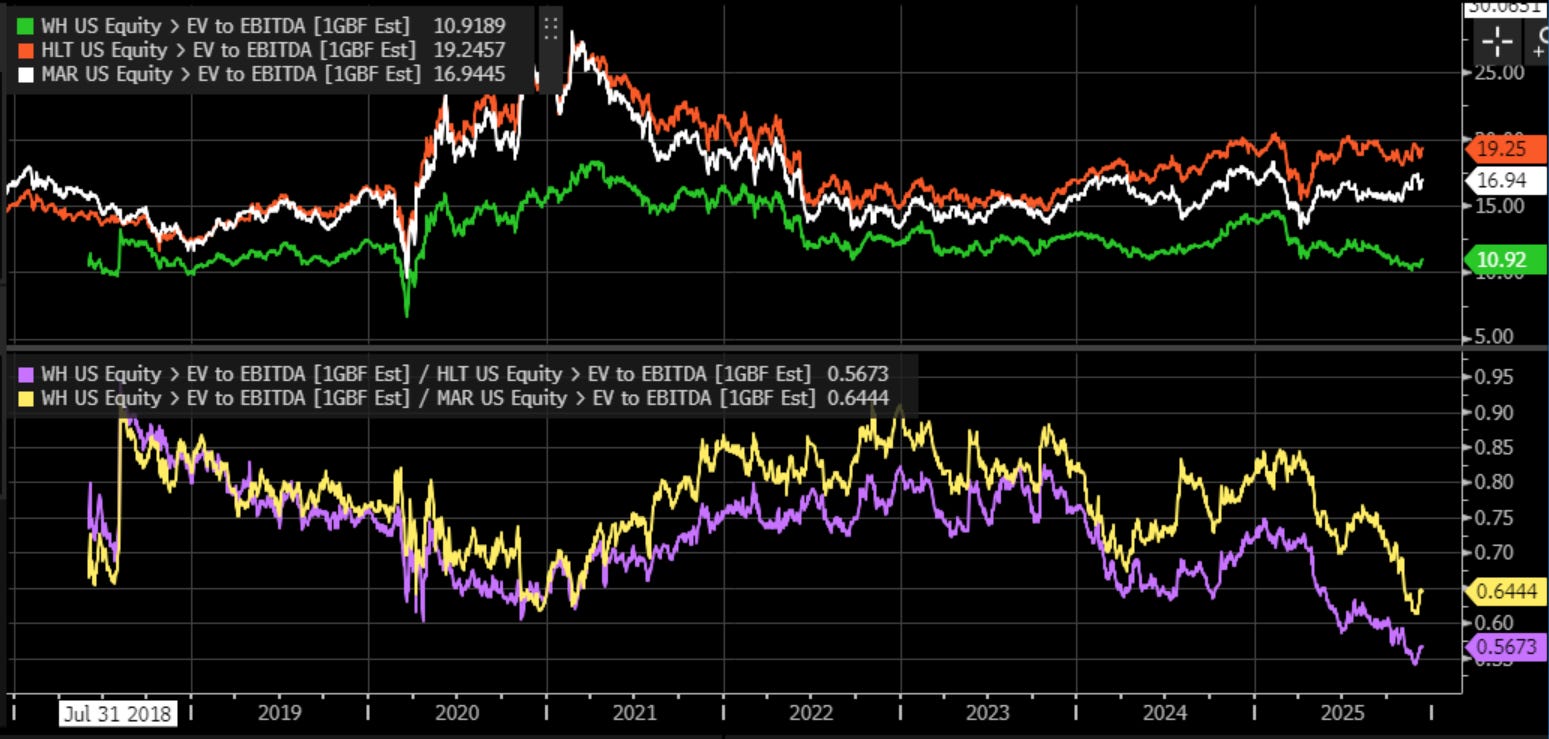
Assuming no multiple expansion, WH could produce double-digit returns. A more optimistic scenario could see WH trading back to the historical discount versus HLT. If we assume a 25-35% discount versus HLT on its NTM EV/EBITDA multiple, the WH’s multiple could expand from ~11x EBITDA to 12.5-14.5x, which would add an additional ~14-30 percentage points to the stock’s return in 2026—making it potentially the most asymmetric stock in the group.
*This is meant to be illustrative, not a recommendation—use your own assumptions and analysis.
Source: Bloomberg