US Travel Trends: Summertime Sadness?

Recap: Current travel data and forward-looking trends indicate a potential demand weakness this summer. Public travel companies will likely need to call out weakening trends as summer progresses if data doesn’t improve.
Most publicly traded travel companies, including airlines and hotel chains, have struck an optimistic tone about the 2025 summer season after the initial pause in the spring from tariff-induced uncertainty. Much of this commentary focuses on stronger trends in April, following a weaker March, and general optimism that the shorter booking windows they’re seeing will not ultimately translate into materially weaker revenue. However, early indicators point to a slower start to summer travel.
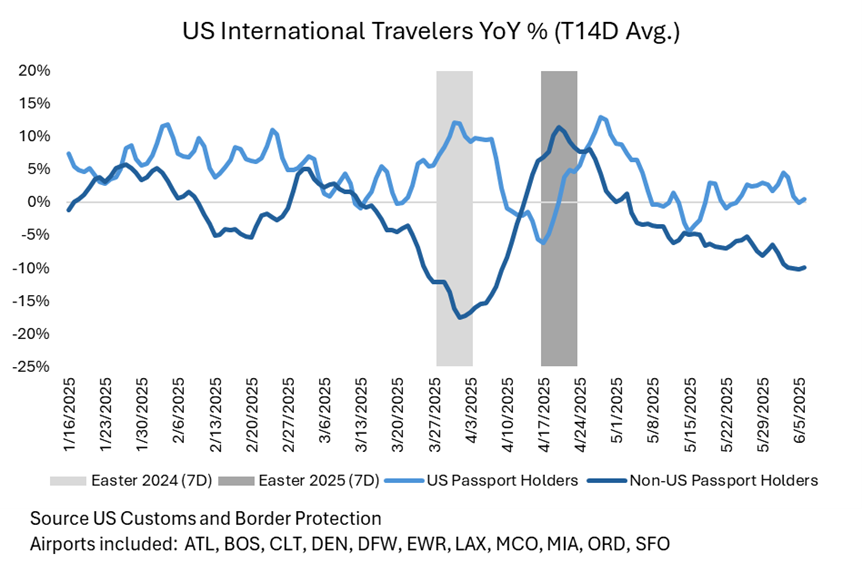
The WSJ recently published an article citing that foreign arrivals at the US’s main airports were down 6% YoY (as of the end of May). These figures included the tail-end of tailwinds from Easter occurring later this year versus 2024. Since Easter, international arrivals have worsened. Non-US passport holders entering 12 of the country’s largest airports is -10% on a trailing 14-day rolling average, with the trailing 7-day average at -13% (as of June 6). For May, non-US passport holders entering 12 of the country’s largest airports were down 6.6% year-over-year, in line with the WSJ figure.
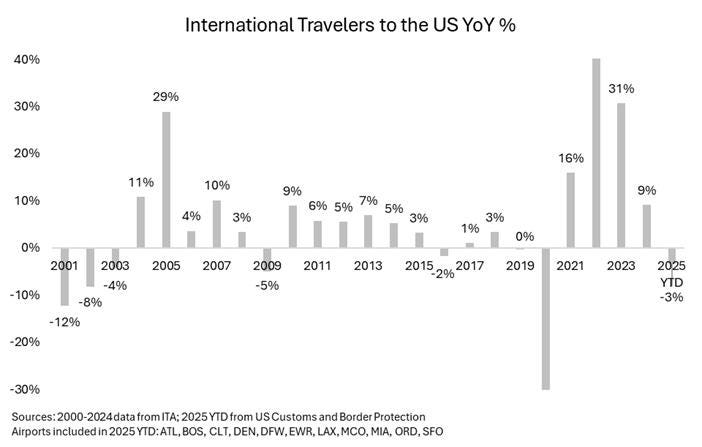
Year-to-date, international travelers to the US are down more than 3% year-over-year, which would be the first decline, excluding COVID-impacted 2020, since 2016 and the worst drop since 2009. 2021-2023 growth benefited from the post-Covid recovery, but international travel demand to the US typically grows unless there's a demand shock / recession (GFC, 9/11, dotcom bubble, Covid), which the current data does not support.
Weakness in international demand is unsurprising. It’s been well-documented that Canadians are foregoing US summer travel in favor of domestic or other foreign markets. Data from Statistics Canada, cited by the WSJ, shows that in April, the number of Canadians traveling to the US by air and car was down 20% and 35% year-over-year, respectively. Furthermore, Canadian summer flight bookings to the US are down by 22%. The US Travel Association estimates Canadians accounted for ~25% of all visitors to the US in 2024 so declines of 20%+ are likely having a material impact on international inbound demand.
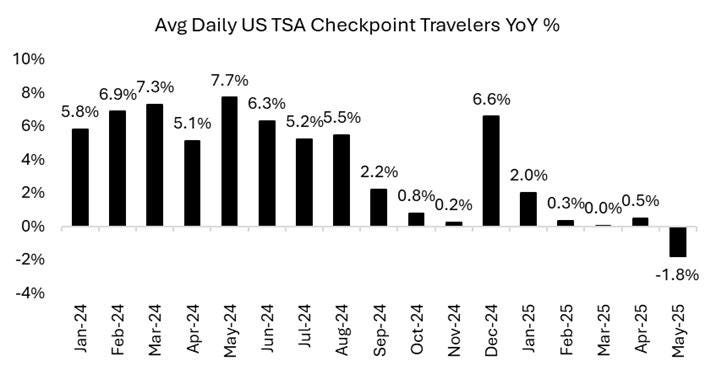
In normal times, international travel provides a tailwind to total US travel, especially in the summer months when travel over-indexes to leisure, but it still only accounts for a mid-single-digit percentage of total trips in the US annually. A 50bps impact to US travel demand (assuming 5% of total trips and the current -10% YoY trends hold throughout the summer) would generally be offset by domestic travel growth. However, domestic travel is also showing weakness. Average daily US travelers going through TSA checkpoints – a proxy for travel demand – were down 1.8% in May – after ranging from 0-2% in four prior months to start the year. If we assume international accounted for 5% of total demand, then the domestic growth was also negative in May.
The June data thus far is showing continued softness, with the 14-day and 7-day averages both down 4%+ as of June 10.
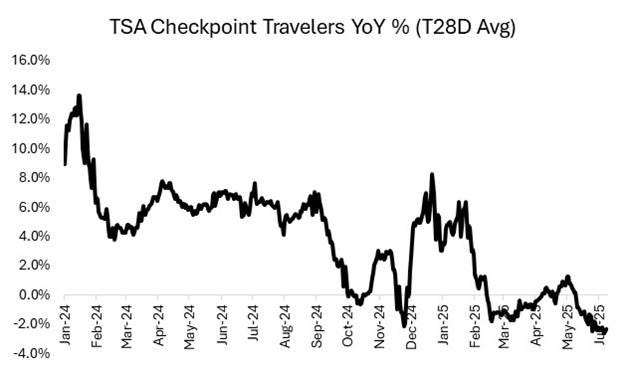
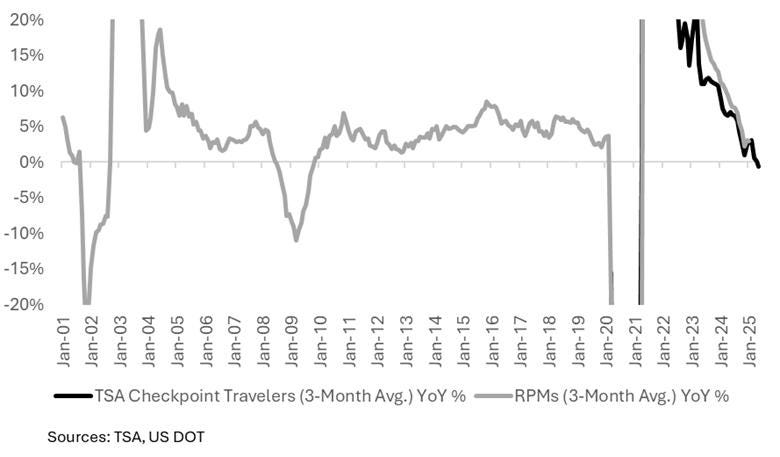
Similar to international travel, domestic travel demand typically grows absent economic contraction. Revenue passenger miles (RPMs) – a proxy for air travel demand – have only gone negative three times in the past 25 years (9/11 / dotcom bubble, GFC, and Covid). Unlike the TSA data which only dates back to 2020, RPM data can be analyzed over decades. The TSA and RPM data are correlated, and can be used relatively interchangeably as an air travel demand proxy. The TSA data informs us that RPMs growth likely went negative in May, with continued declines so far in June.
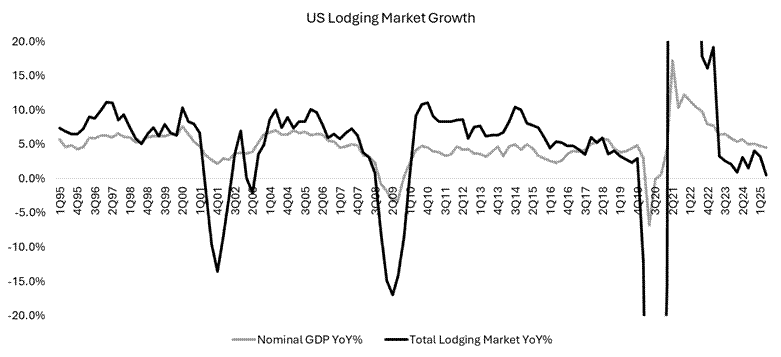
Hotel data is also unsurprisingly weak. Revenue per available room – or “RevPAR” – which calculates the amount of revenue a hotel generates each night, is down 2.5% for the first two “unofficial” weeks of summer, starting with Memorial Day and has been flat year-over-year since April. Like air travel, the US hotel industry typically grows absent economic contractions, usually in line with or better than nominal GDP. Lodging has trailed nominal GDP since early 2023, with growth diverging more in Q2 (my Q2 estimates assume the last 3 weeks of the quarter resemble the current trends over the past month).
Trends started to weaken leading up to Liberation Day, with Delta pointing to softening trends in mid-March. Then there was a more protracted pause post-Liberation Day. Most travel companies have called out stabilizing-to-improving trends since April 2nd, which was reflected in the data – helped by the Easter calendar shift. What is more surprising is that this recovery hasn’t sustained, with data worsening over the last 2-4 weeks and at least some forward-looking data inform us that this may continue into the summer. STR (owned by CoStar), which tracks data for 87k+ hotels globally – and most of the hotels in the US – shows room nights on the books for July and August down in the low single digits year-over-year. The graph below is occupancy on the books for future dates as of the end of May. The data can be volatile from week to week, but July and August consistently show a negative trend.
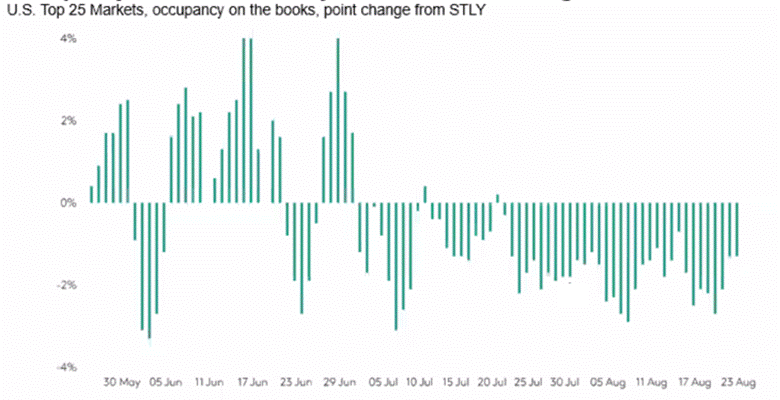
A word of caution before over-extrapolating this data: for July and August, most hotels and vacation rentals typically have only 35-50% of their summer stays booked. And if the forward-looking data is mostly from shorter booking windows, sales could strengthen as the summer progresses. Shorter booking windows can occur when travelers push out booking travel until closer to arrival, usually from a drop in confidence about economic conditions. This last occurred in late summer 2024, but ultimately proved to be a blip after growth recovered in the fall, setting the stage for a strong Q4. The trends shown above may improve as we approach arrival. And the relatively better on-the-books June trends shown in the graphic could indicate demand will firm up closer to the arrival date in July and August.
Objectively, the current economic data favors a rebound later in the summer or early fall. Wage growth – while slowing – is still supportive of healthy PCE growth at ~4% year-over-year. Additionally, Q1 corporate earnings remained healthy. However, if growth trends don’t improve over the coming weeks, we’ll likely see travel companies start talking down Q2 numbers by July 4th. More importantly, the longer the weak travel data persists, the louder the chatter of a more prolonged travel downcycle becomes.